
How much do election schedules matter?
How much do election schedules matter?
Life, death, election schedules, and voter turnout

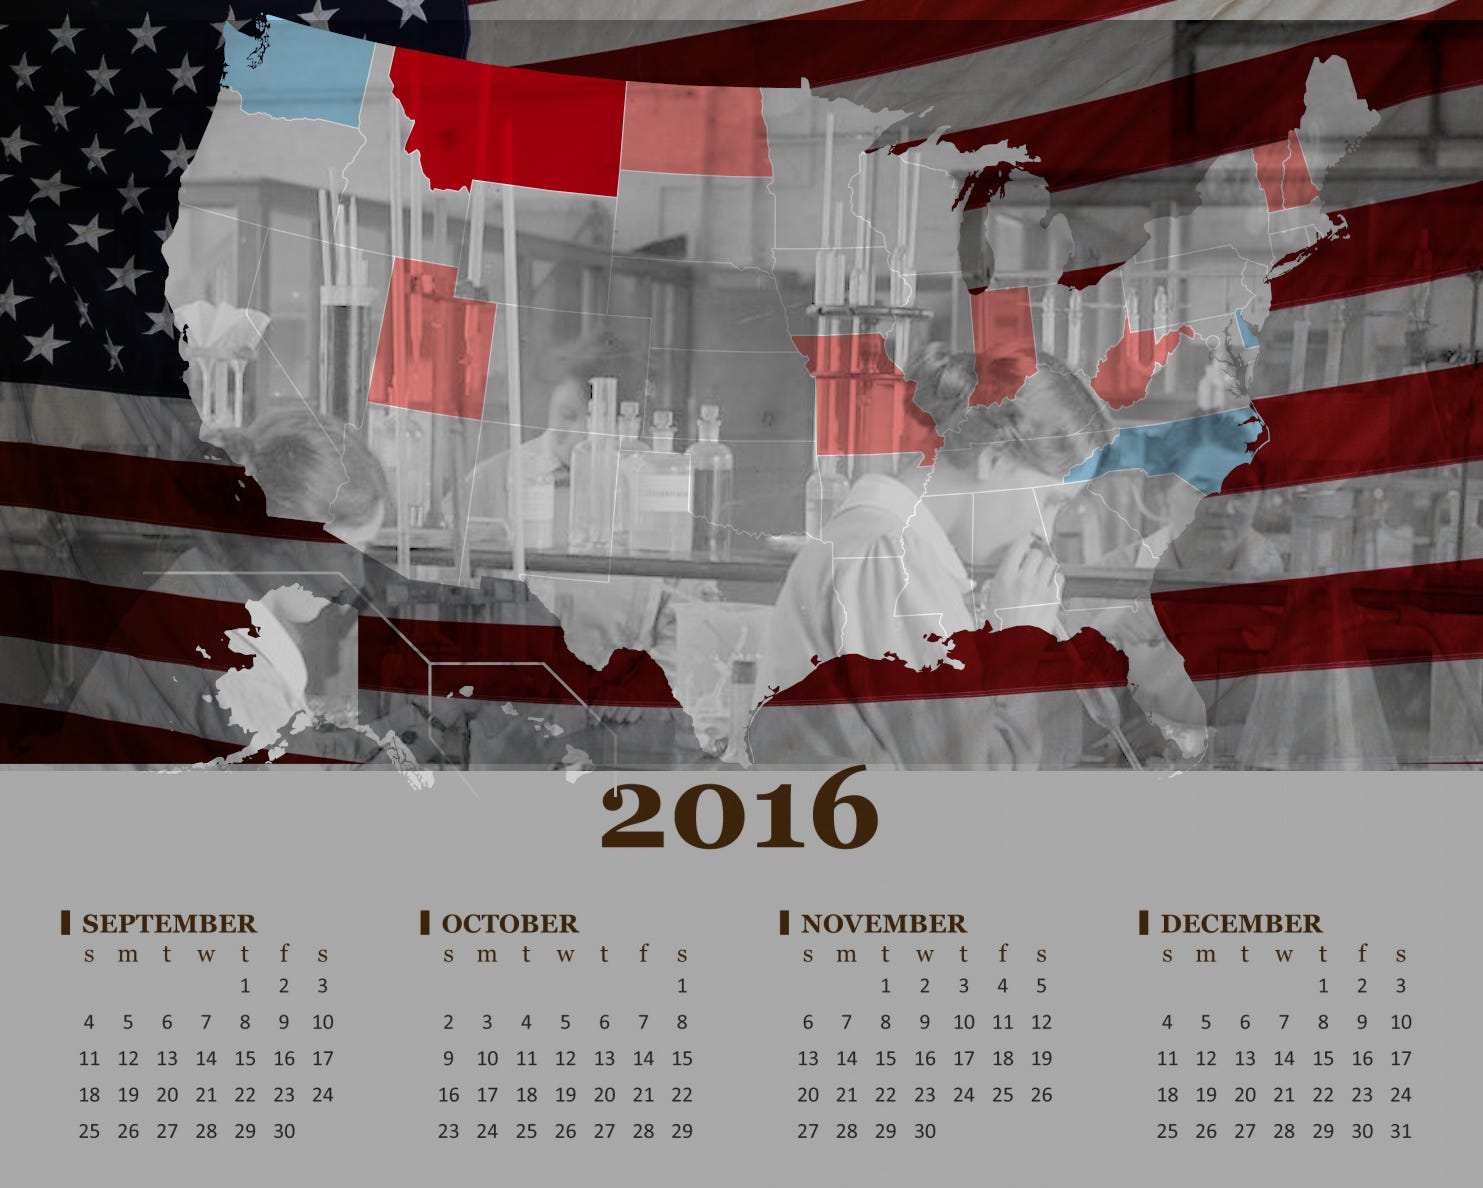
It has often been said that the states are “laboratories of democracy,” natural testing grounds for experiments in governance. For example, states differ in how their election schedules work. Some states, such as North Carolina, elect governors during presidential election years when voter turnout is highest. Others, such as New Jersey, elect their state governments in odd-numbered years, when turnout is lowest.
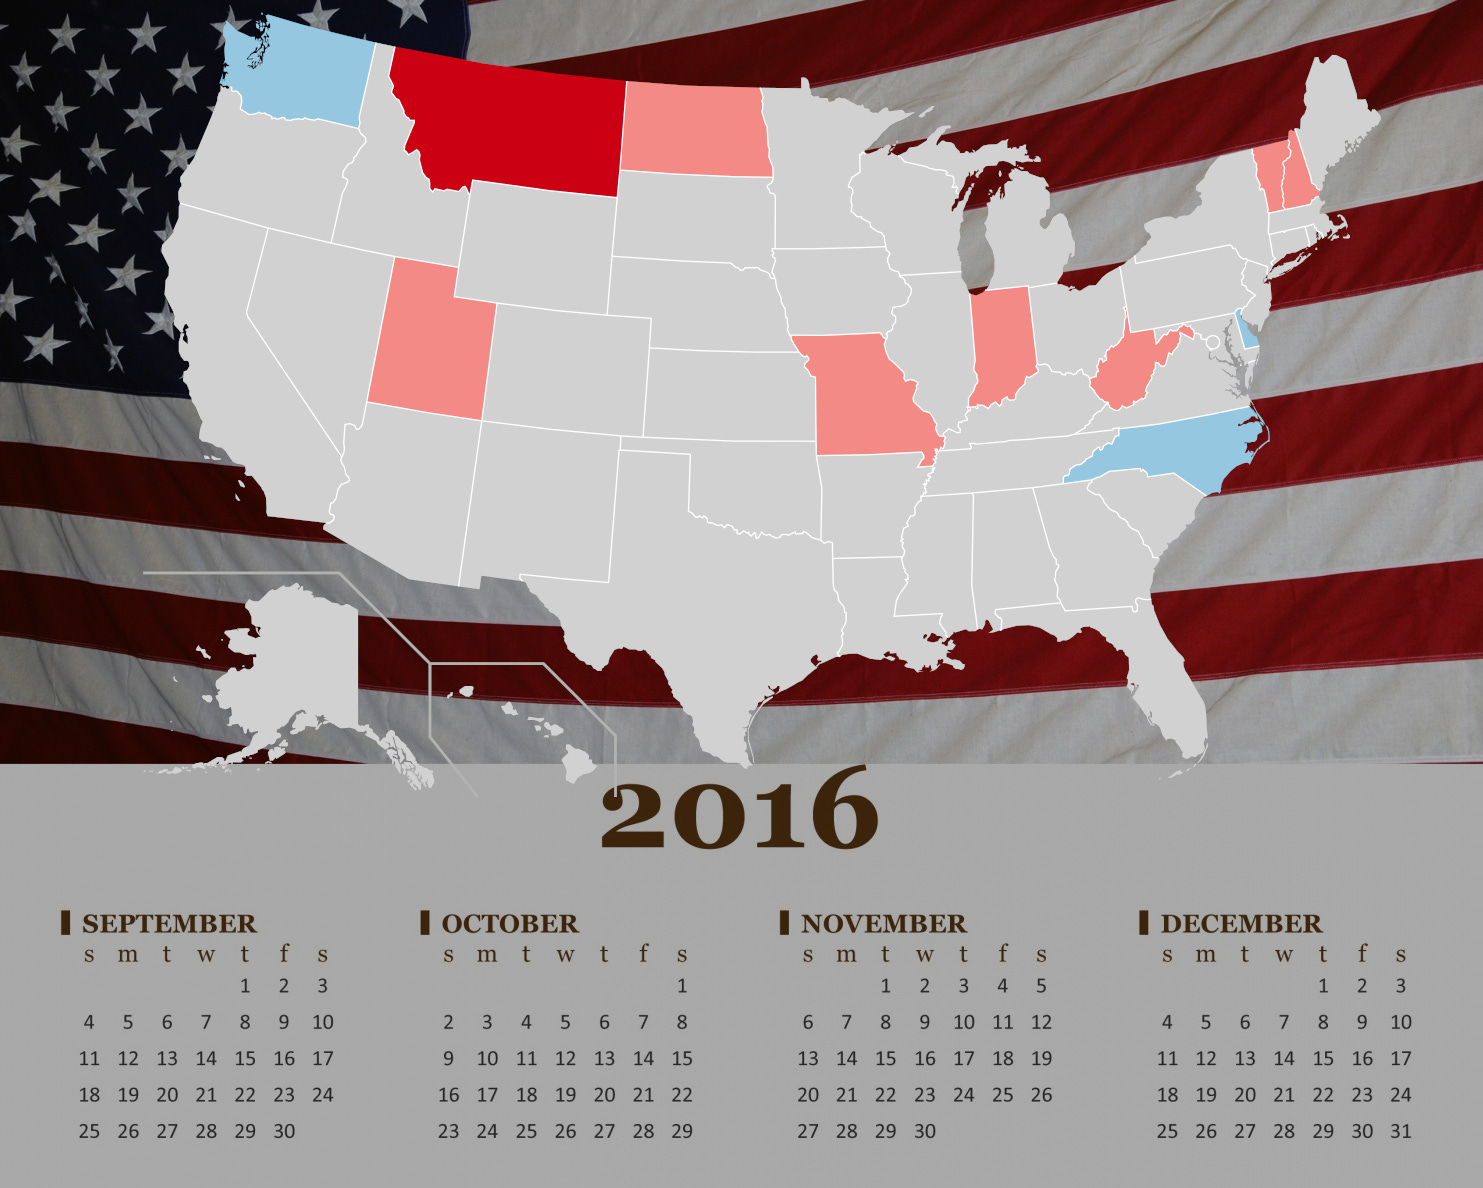
.This comes after decades of steady shifts by state and local officials to move state and local elections away from the federal schedule. During the 1960 presidential election, more than half of all states (27 out of 48) held gubernatorial elections. During the 2020 presidential election, fewer than a quarter of all states (11 out of 50) held gubernatorial elections.
The results of this experiment are clear: State governments that are more accountable to the will of the entire voting population are more effective, more competent, and less corrupt. This is clear from approval ratings; it is clear from corruption data; and the COVID-19 crisis illustrated it vividly.
The will of the people
The most general measure of a governor’s competence tends to be their approval rating. Once in office, a governor may become considerably more or less popular based on their actions. Some of this is a question of competence; some is a question of whether or not the governor reflects the will of the people.
Do governors elected at the same time as the president more closely reflect what their voters want for their home state, or do presidential coattails simply muddy the waters, allowing an otherwise unpopular governor to get re-elected because he shares a party with the president?

Based on gubernatorial approval rating data from Morning Consult, governors elected at the same time as the president have higher-than-average approval ratings. The president being on the same party ticket doesn’t blind voters to a governor’s faults; instead, it simply brings more voters into the voting booth. Higher turnout means a governor who reflects the will of the people.
Corruption
New Jersey and Louisiana are very different states, but they share two unusual characteristics: They elect their state governments in odd-numbered years, and they have a long history of serious corruption problems. This is not a coincidence. If you look at the number of convictions for corruption in all fifty states from 1970 to 2010, adjust by population, and break up the states by their different gubernatorial election schedules, a striking pattern emerges:

The typical state holding gubernatorial elections in lower-turnout years has almost twice the rate of corruption convictions as a state that holds gubernatorial elections during high-turnout presidential election years. Other measures of corruption are more subjective, but point towards the same general pattern. It’s no surprise; lower-turnout elections are more easily influenced by special interests.
Cause and effect are difficult to separate here. For example, Illinois had serious corruption problems before 1978, when it changed from electing governors in presidential election years to electing governors in midterm elections. Corrupt governments may seek to avoid accountability by moving election schedules around.
COVID-19 and gubernatorial elections
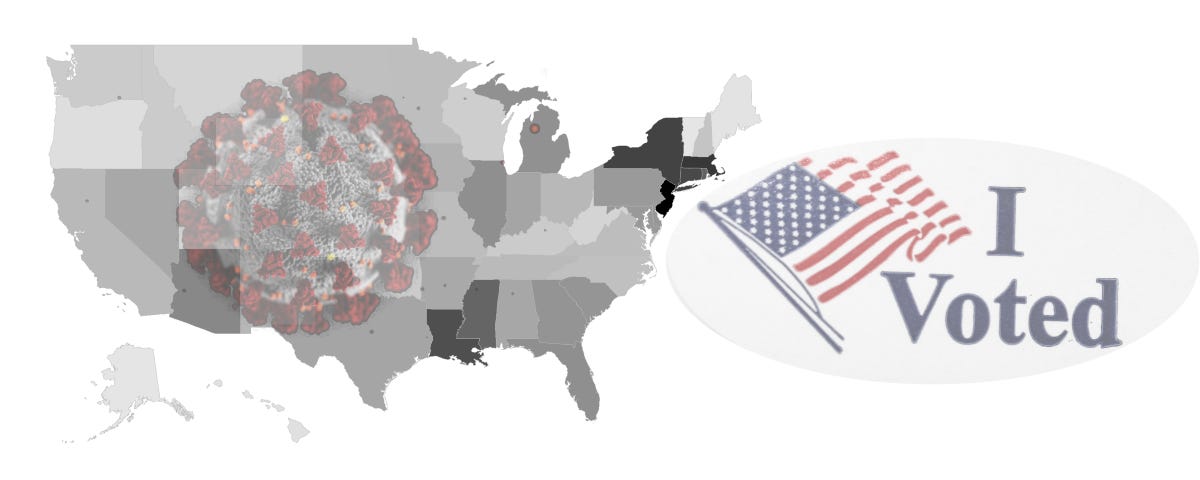
The COVID-19 pandemic hit the United States in earnest in March of 2020. By November of 2020, states with Democratic governors and states with Republican governors had similar numbers of COVID deaths per capita. There were large differences in outcomes between states, but it wasn’t partisanship that drove the difference in the early stages of the pandemic. It was competence.

More competent state governments had better testing, better contact tracing, and better treatment because of more efficient emergency allocation of medical resources. New Jersey, the state with the lowest voter turnout in its previous off-year gubernatorial election, had the highest death rate per capita. The state with the lowest death rate per capita, Vermont, had voter turnout well above average in its previous gubernatorial election - which it holds every two years for maximum executive accountability.

For me, the geography of gubernatorial election schedules was very familiar, and once I started looking at COVID data on a state-by-state basis, the pattern I saw in everything from test positivity rates to death rates was shockingly familiar. I immediately broke them down by gubernatorial eleciton schedule, and was shocked by the strength of the relationship. The relationship held strongly through every control I tried to throw at it, and in every version of the data I examined.
Overall, states with better election schedules experienced half the reported COVID-19 death rate. It wasn’t because of problems with reporting. The more I dug into the the question of undiagnosed COVID-19 deaths, the more clear it became that states with better election schedules were also more likely to diagnose COVID-19 and more likely to report that diagnosis to central data collection agencies. If anything, the gap in actual COVID-19 deaths seemed to be larger than the gap in reported COVID-19 deaths.
Recap
The state governments as laboratories of democracy have conducted a natural experiment. Some of them set their election schedules at odds with the federal election schedule; some set their election schedules in perfect accord with the federal election schedule. The results are in.
The perennially low voter turnout caused by scheduling gubernatorial elections may have killed more than a hundred thousand Americans in the year 2020. Lower voter turnout leads to lower levels of competence and higher levels of corruption, while higher voter turnout gives us more satisfactory politicians.
In other words, democracy works better with higher voter turnout.