
Gerrymandering and North Carolina
Gerrymandering and North Carolina
After the 2010 elections, the Republican Party gained a majority in the state legislature of North Carolina for the first time since…

After the 2010 elections, the Republican Party gained a majority in the state legislature of North Carolina for the first time since shortly after the Civil War. They promptly gerrymandered both their own districts as state legislators and the state’s Congressional districts.
In the 2012 Congressional elections, Republicans picked up three seats — in spite of the fact that the Republican share of the vote statewide dropped by 4 points. North Carolina’s delegation shifted from 7D-6R to 4D-9R.

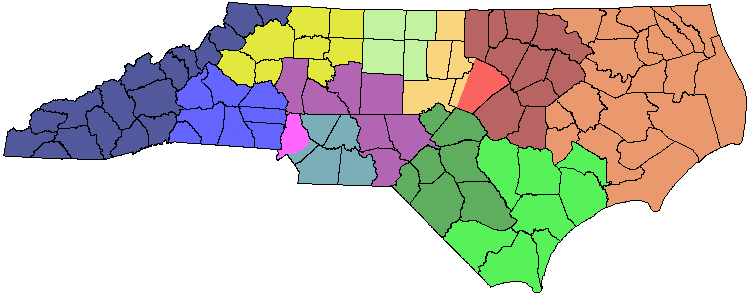
As you can see from the side by side comparison of the maps before and after, many districts already featured bulging inclusions and exclusions and were not particularly compact. In both cases, the 1st and 12th districts were deliberately designed as majority-black districts.
The narrow snake-like 12th district (violet in the above map) accomplished this by collecting together neighborhoods of black voters in a various cities and counties from Greensboro to Charlotte along the I-85 corridor. The jagged lines interfacing between the 1st district (dark brown) and 3rd district (light brown) had the effect of packing additional black voters into the 1st district.

Both the 1st and 12th districts were designed as majority-minority districts after the 1990 Census. The map that took effect for the 1992 elections was actually the second map drawn by North Carolina’s state government; the first map, containing only one majority-minority district, was rejected by the Department of Justice. The Department of Justice ordered a map with two majority-minority districts. The resultant blatant racial gerrymander led to no less than three Supreme Court cases: Shaw v. Reno (1993), Hunt v. Cromartie (1999), and its continuation Easley v. Cromartie (2001).
The Republican maps drawn in the wake of the 2010 Census have drawn their own pair of Supreme Court cases; in Cooper v. Harris (2017), the Supreme Court declared the maps unconstitutional gerrymanders. A redrawn set of maps were challenged again, declared unconstitutional by the 4th Circuit Court of Appeals in a 2018 case, which was reversed on appeal to the Supreme Court quite recently as Rucho v. Common Cause (2019).

In both sets of cases, the attempts to defend the districts drawn revolved around claiming that the maps were partisan, rather than racial, gerrymanders. In neither case has the party drawing maps tried to pretend that North Carolina’s maps have not been gerrymandered; the legal questions have all revolved around what type of gerrymander the districts represented and whether, if it was a racial gerrymander, it was a permissible sort of racial gerrymander under the 1965 Voting Rights Act.
Packing and majority-minority districts
The Democratic maps of 1992, 1998, and 2002 all were designed to produce a 1st and 12th district that would be controlled by black voters. The Republican map of 2012 was designed in a very similar fashion — which, in the current political environment, guaranteed they would be unable to effectively compete in those districts.
Why would the Republican party draw a majority-black district when that district would be safely Democratic? The answer comes from the techniques of cracking and packing. When you gerrymander, your goal is to win districts by narrow margins, and lose them by large margins. You can do this by packing concentrations of opposing voters together or by cracking strongholds of opposing voters into different districts artificially.
The Republican state legislature packed as many Democratic voters as possible into districts 1, 4, and 12, hoping to win the rest of the state. Given that black voters are overwhelmingly Democratic and that party registration numbers are very unreliable indicators in North Carolina, packing together black voters was the easiest way to concentrate Democratic voters.
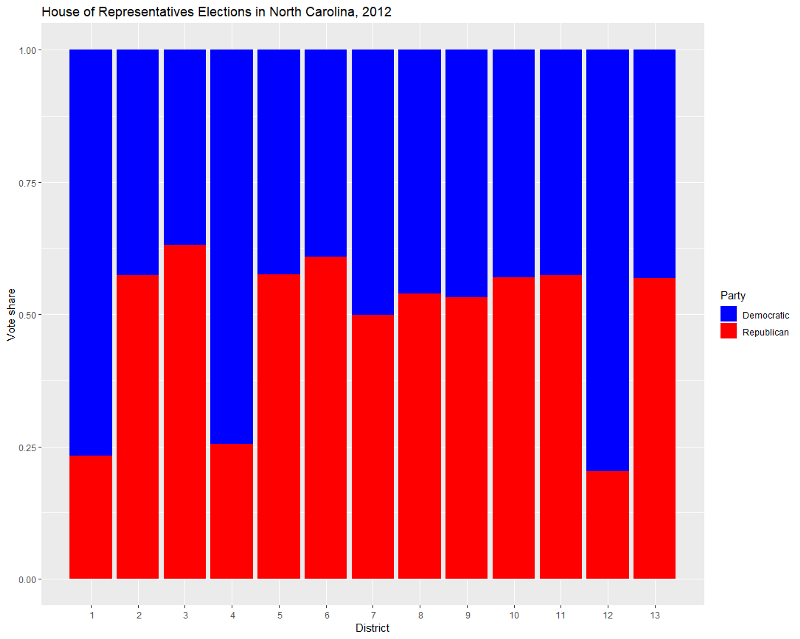
As you can see, Republican had huge margins on their losses in the two minority-majority districts (1st and 12th) as well as a third packed Democratic district (4th), and narrow margins in their wins. Overall, Republicans earned only 50.6% of the vote in that election, but won 9 out of 13 races. (They had an unexpected narrow loss in District 7, where a conservative Blue Dog Democratic incumbent, Mike McIntyre, managed to hold onto his seat.)
The fact that in the current environment, majority-minority districts and particularly majority-black districts are naturally “packed” Democratic districts means that Republicans frequently have an incentive to create and maintain majority-minority districts (and particularly majority-black districts).
Out of fifty-one representatives in the Congressional Black Caucus, only half a dozen represent districts with more white voters than black voters; and only two of the districts with more black voters than white voters currently have a white representative in Congress. One of those half-dozen districts with more white voters than black voters is the newly redrawn 12th District in North Carolina. Alma Adams, representative for the 12th district, was first elected in 2012, when the district lines included a majority-black population. She has remained in office as an incumbent in a very safely Democratic district.
These two facts show an odd alignment of interests between the Congressional Black Caucus and the Republican Party: As long as black voters are reliably Democratic, Republicans benefit by packing them tightly into majority-minority districts where black voters outnumber white voters — the same kinds of districts that typically elect members of the Congressional Black Caucus.
If you draw a fair map for North Carolina without regard to partisanship or race, such as the above map (which is likely to elect a 6D-7R or 7R-6D delegation), it’s unlikely that it will have any districts with more black voters than white voters. Why?
Fair districting and race in North Carolina
In general, a political party with (50+X)% of the population can expect, under typical fair districting, to hold a majority in about (50+2X)% of districts. This basic rule of thumb is the benchmark used in calculating the efficiency gap, one of the major current measures of partisan misrepresentation. If a party earns 55% of the vote, they will typically win 60% of the districts; with 75% of the vote, they are likely to win every single district. District-based systems are disproportionate in that way even when the districts are fairly drawn.
We can also apply this concept to race. As of 2016, North Carolina’s voting population was 22% black, about the same as the overall fraction of the population. The formula breaks down for parties with less than a quarter of the electorate; it predicts that black voters would make up a majority in less than zero districts (-0.78). Independent of geography, a state with North Carolina’s demographics is likely to end up with 11 majority-white districts and 2 minority-majority districts with white pluralities.

Geography is worth examining. While North Carolina’s towns and cities often feature racially segregated neighborhoods, very few cities or counties have more black residents than white residents; and all of those cities or counties are small. As of the 2010 Census, none had a population of more than 60,000. The Congressional districts drawn in the wake of the 2010 Census needed to contain over 700,000 total residents — more than the total populations of every majority-black county combined.

For a contrasting example, see Michigan, which is similar in size to North Carolina. Only 14% of the population of Michigan is black, but Michigan’s racial geography is different.
Detroit itself has about half a million black residents, making it a natural anchor for at least one majority-black district. The current Michigan map divides Detroit between two majority-black districts (13th and 14th), both non-compact and strongly more Democratic than the surrounding districts.
Fair districts
Political parties always have an incentive to gerrymander to maximize their own power. Partisan gerrymanders and racial gerrymanders are difficult to distinguish, because of the close relationship between race and partisanship. Partisan gerrymandering can serve as a screen for racial gerrymandering, and vice versa. North Carolina’s Congressional maps — as well as the maps drawn for the state legislature — have illustrated these problems starkly.
If a party struggles to get the support of a minority group, then that party has a strong incentive to pack the minority group as tightly as possible into a district, e.g., black voters and Republicans. Conversely, as long as we use single-member districts, drawing boundaries fairly and impartially will tend to lead to the election of fewer representatives from minority groups.
In the long run, breaking free of gerrymandering requires changes in the process of how maps are drawn and approved — or moving to a system other than one with single member districts, such as a proportional party list system or the multi-winner RCV system endorsed by FairVote.